Each May, the United States recognizes the influence and contributions of Asian and Pacific Islanders during AAPI Heritage Month. It also serves as a time to reflect on the many differences among AAPI individuals in this country.
The 19.7 million Asians and Pacific Islanders living in the United States make up one of the most diverse racial groups in the country. Data from the 2021 American Community Survey paint a picture of a community that spans the socioeconomic, educational, and cultural spectrum.
AAPI Individuals in the United States
The majority of those who self-describe as Asian or Pacific Islander (AAPI) live in the state of California, which is home to 6.1 million AAPI individuals (30.9% of AAPI individuals living in the United States). California is followed by New York (8.8%), Texas (7.9%), New Jersey (4.7%), and Washington (4%).
While the majority of those who identify with an Asian or Pacific Islander racial group are born outside of the United States (63.2%), a sizeable portion were born here (36.8%). Among those who were born outside of the United States, 60.8% are naturalized citizens.
Ancestry
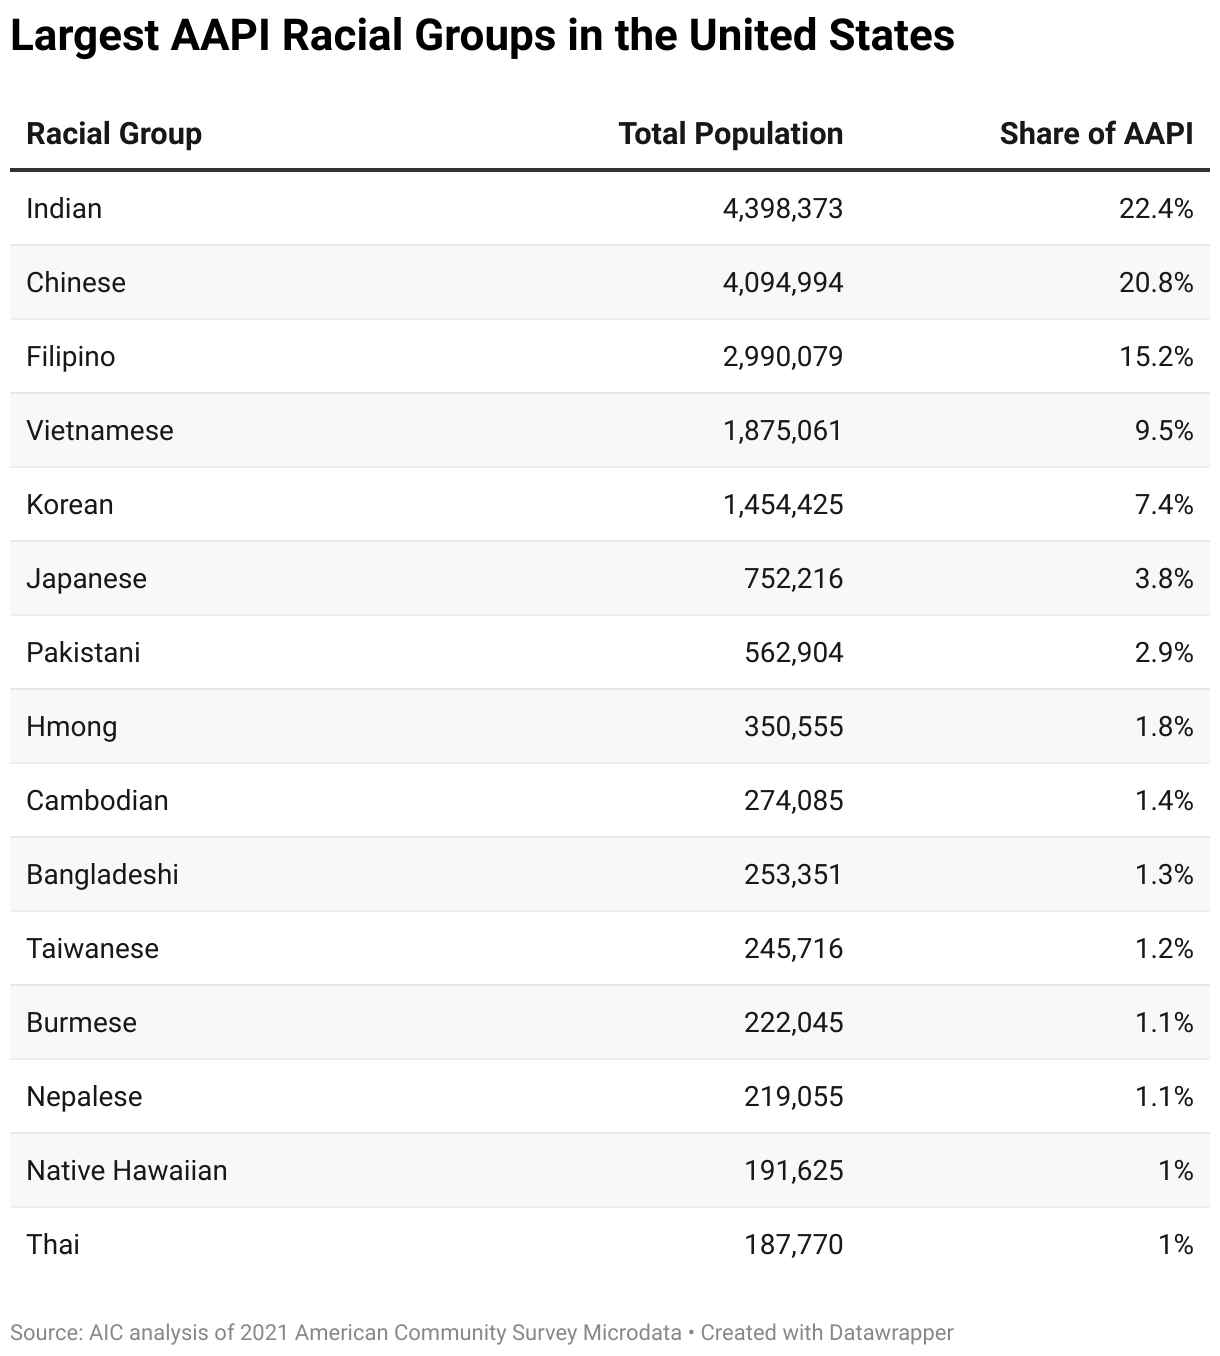
Among those who self-describe as being part of only one racial group, Indians make up the largest group (22.4%), followed by Chinese (20.8%), Filipino (15.2%), Vietnamese (9.5%), and Korean individuals (7.4%). These percentages do not include those who self-describe as having more than one race. Those who self-describe as having more than one racial identity, at least one of which is an AAPI racial group, make up 1.5 % of the U.S. population.
AAPI Immigrants
The top countries of origin for AAPI immigrants mirror the top racial groups among all AAPI individuals. The top country of origin is India (21.4%), followed by China (16.9%), the Philippines (15.4%), Vietnam (10.5%), and Korea (7.9%).
Among those from the top 10 racial groups for AAPI immigrants, those who self-identify as Nepalese are the fastest growing immigrant population with 26.7% having come to the United States since 2016. Those who self-identify as Japanese also have a fast-growing immigrant population with 24.8% having come to the U.S. since 2016, followed by those who are Bangladeshi (22.4%), Indian (21.5%), and Burmese (19.7%).
Education + Workforce
Asian and Pacific Islanders living in the United States are a highly educated group overall—55.5% of those at or over the age of 25 hold a bachelor’s degree or more, compared to 33.7% of those who do not identify with an AAPI racial group. That said, AAPI individuals are also more likely to have an education level below a high-school diploma (12.2%) compared with those who do not identify with an AAPI group (10.5%).
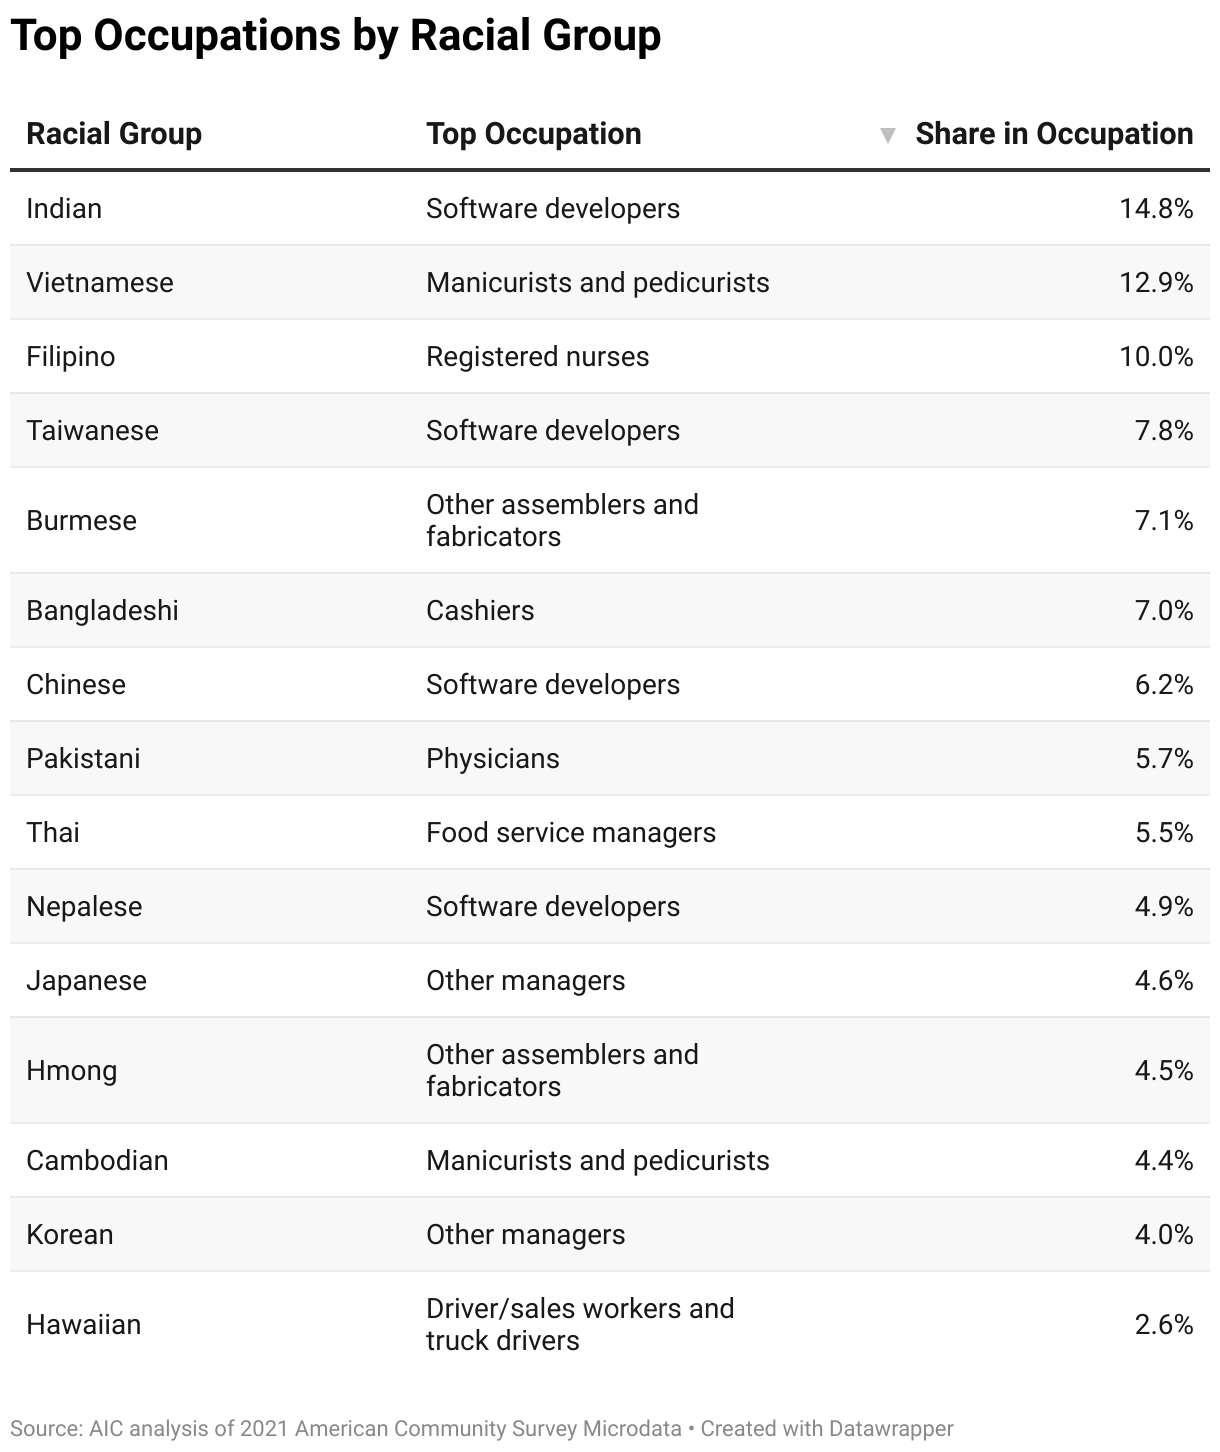
The diversity in education is reflected in the variety of occupations held by Asian and Pacific Islander groups. The top occupations of those belonging to the most populous racial groups are reflected in the table below.
Income + Taxes
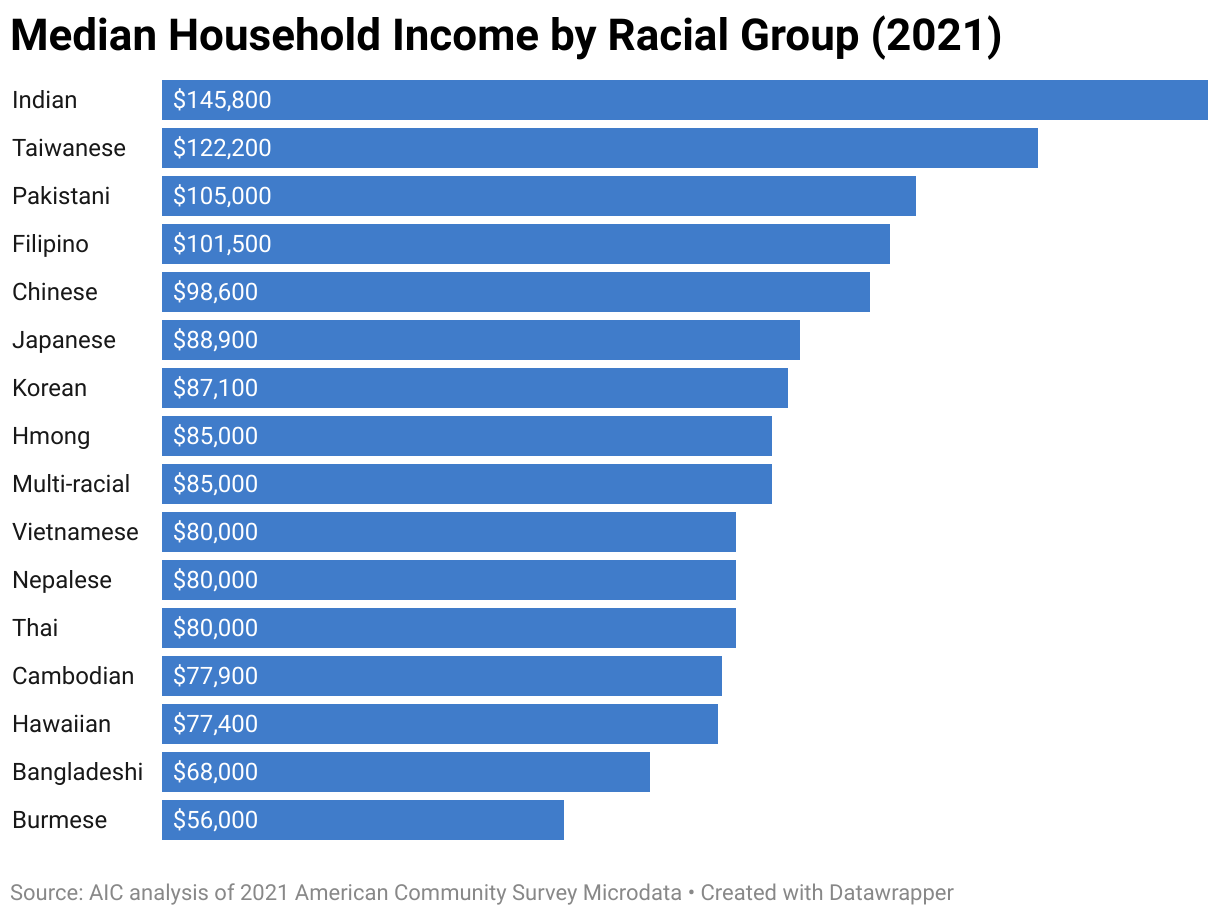
In addition to educational diversity, there is wide variation in income among AAPI households. Households led by those who identify as Indian had a median household income of $146k in 2021, followed by Taiwanese-led households with a median household income of $122k. Burmese-led households, however, had a median household income of $56k.
While 18% of AAPI households are top earners with household incomes falling within the 90th income percentile, 10.1% of AAPI-led households were living at or below the federal poverty line in 2021. Socioeconomic status again varies by racial group. While 23% of Burmese households were living at or below the federal poverty line in 2021, this is true for only 6.2% of Filipino-led households.
AAPI households across the economic spectrum together paid $176.8 billion in federal taxes and $81 billion in state and local taxes in 2021.
These data points only begin to paint a picture of the diverse individuals that fall under the ‘AAPI’ label. While Asians and Pacific Islanders are among some of the most educated and highest earning individuals in the United States, many others have more modest incomes. The month of May, AAPI Heritage Month, is a chance to not only celebrate the many individuals that make up Asian and Pacific Islander communities in the United States—but recognize the work that needs to be done to ensure individuals from all backgrounds have access to opportunities for growth and economic security.
A Note on Definitions
Here Asian and/or Pacific Islander (AAPI) individuals include anyone who self-identified with a singular Asian or Pacific Islander racial group on the 2021 American Community Survey questionnaire. This does not include those who identified with multiple racial groups, one or more of which was an Asian or Pacific Islander racial group. Instead, these individuals are included in the data points assigned to those who belong to multiple racial groups.
FILED UNDER: Asians