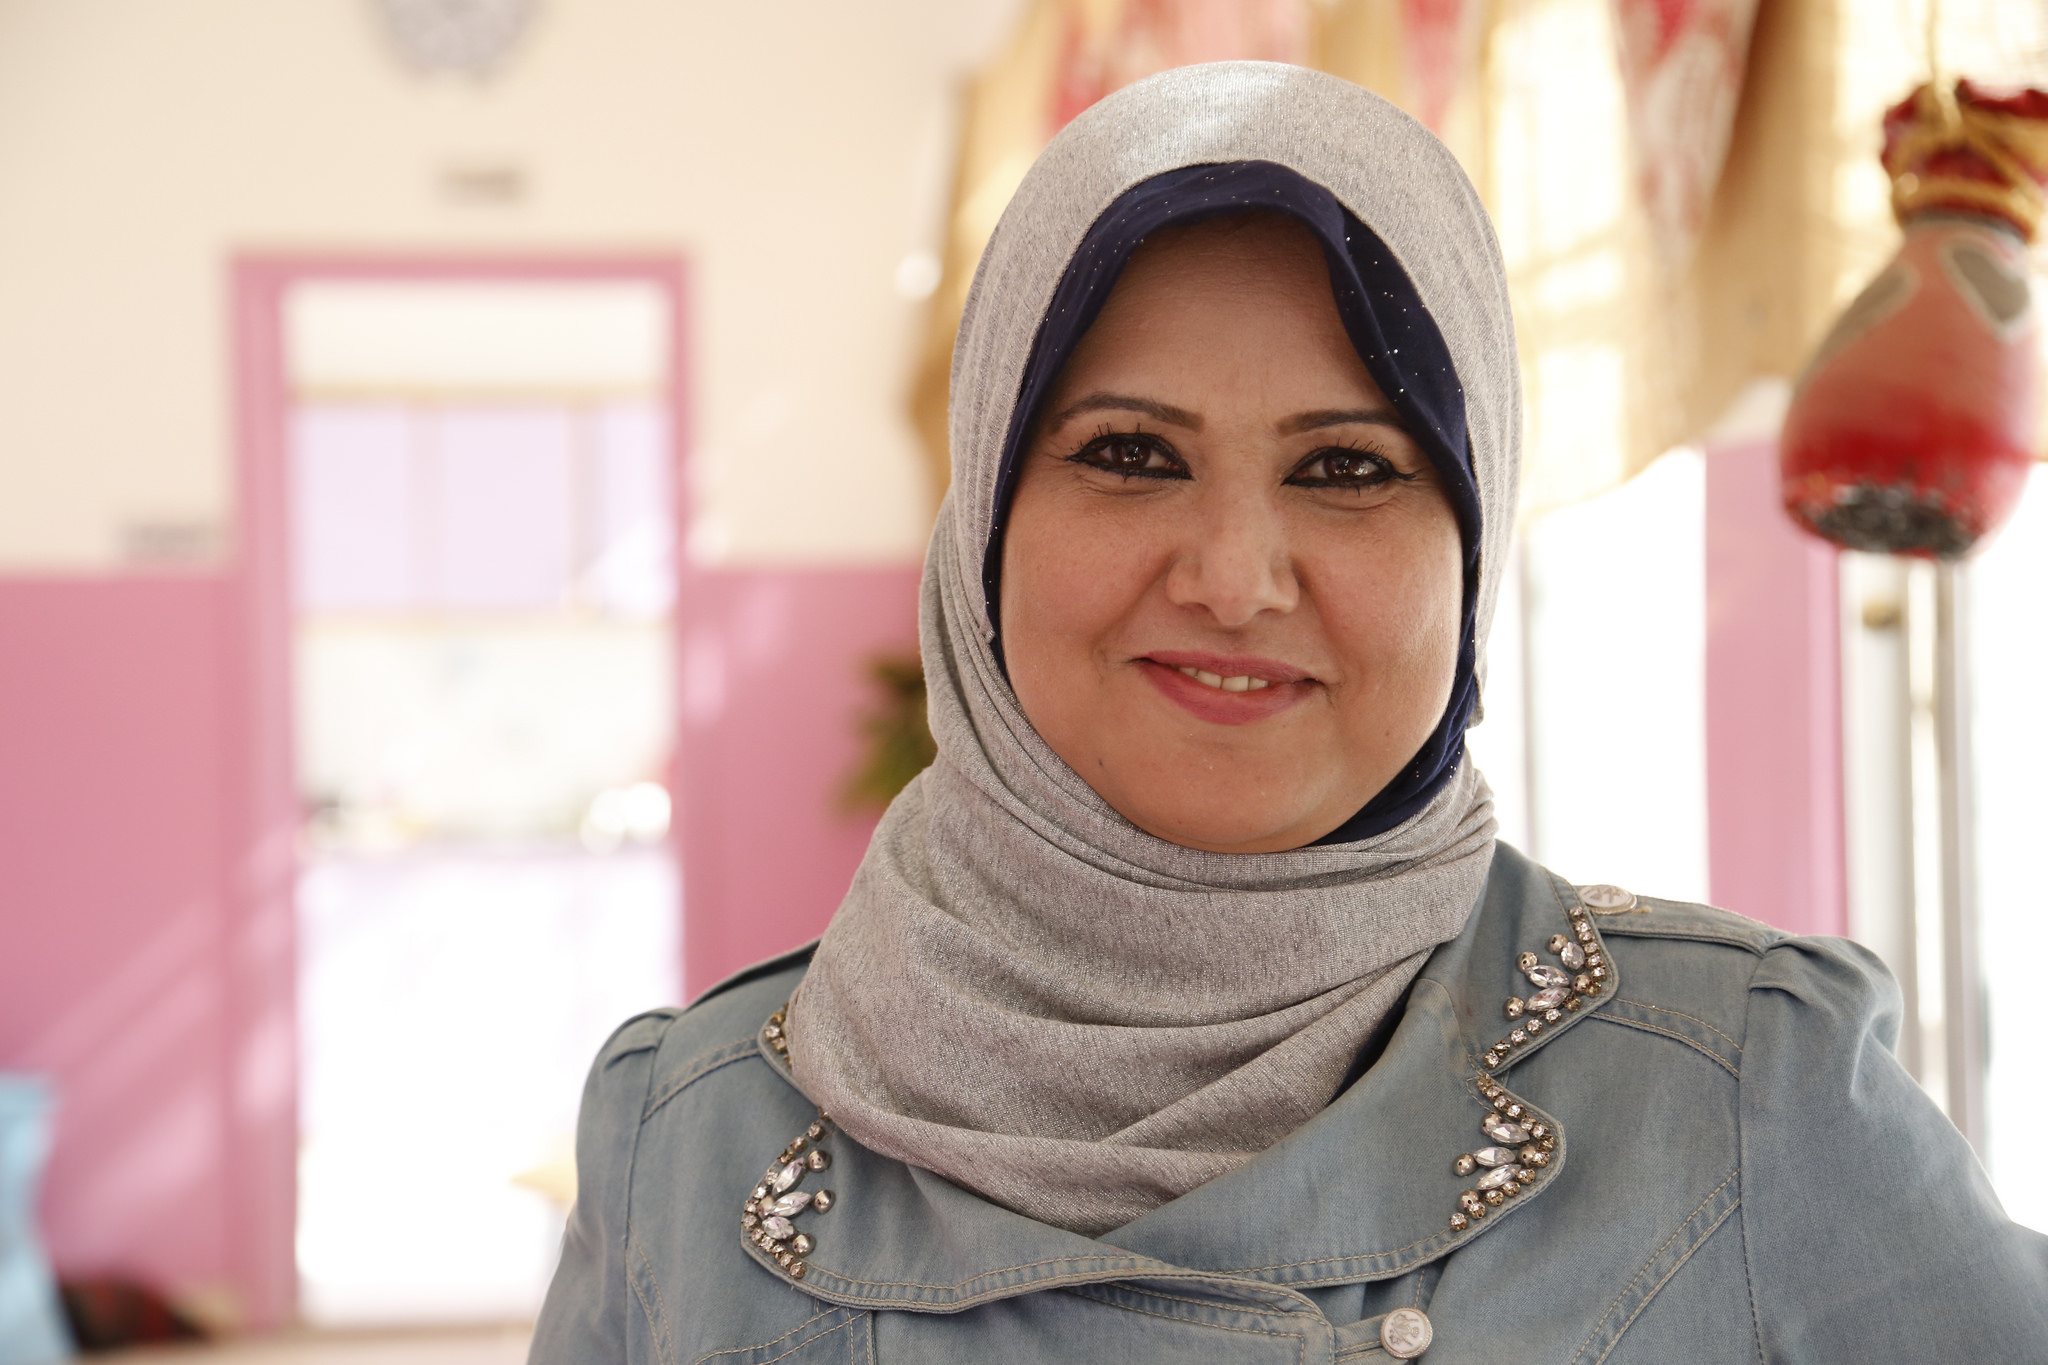
Refugees and asylees are a relatively small share of U.S. immigrants – just eight percent of all immigrants living in the U.S. These are individuals who are fleeing persecution, war, conflict, oppression, and human rights violations in their home countries and who have been granted the ability to reside permanently in the U.S.
A new report by the Center for American Progress and the Fiscal Policy Institute examines four refugee groups – Bosnians, Burmese, Hmong, and Somalis. Together, refugees from these countries make up about 1 of every 5 refugees resettled in the U.S. between 1982 and 2014. They reflect a diverse range of cultural, linguistic, religious, and ethnic backgrounds; they arrived in the U.S. at different historical periods. Examined together and separately, they highlight the refugee experience with integrating into the U.S. Because refugees arriving in the U.S. may have been traumatized and fled their homes with no pre-planning and little but the clothes on their backs, it understandably may take time for them to adapt to life in a new country. But the U.S. refugee resettlement program emphasizes work and self-sufficiency, and the results speak for themselves: refugees are integrating.
This is particularly important in metropolitan areas of the U.S. where refugees tend to be concentrated. States like Minnesota, Ohio, Wisconsin, and Indiana have relatively small foreign-born populations, but many of the immigrants residing there are refugees. For example, in Wausau, WI only four percent of the population is immigrant, but Hmong refugees make up 39 percent of the immigrant population. In Sheboygan, WI, only six percent of the population is immigrant, and Hmong and Bosnian refugees comprise 28 percent of all immigrants. In these smaller U.S. metro areas, refugees are revitalizing the economy by working, starting businesses, and buying homes.
At a time when refugees are making headlines, candidates are threatening to stop accepting refugees, and states are suing to refuse refugee resettlement, it’s important to review the facts surrounding this population:
1. Refugees are working.
Men in the four refugee groups have labor force participation rates that are comparable to or higher than those of U.S. males. This is true for recent arrivals and refugees who have been in the country for 10 years or more. The labor force participation rate for U.S.-born men is 81 percent. For Hmong men it is 75 percent; for Somali men it is 84 percent; for Burmese men 88 percent; and for Bosnian men 90 percent. However, refugee women tend to start with lower labor force participation rates, but they rise steeply over time. After 10 years, female refugees from these four countries participate in the labor force at rates roughly equal to or higher than that of U.S.-born women.
2. Refugees move up the occupational ladder and earn more over time.
Over time, refugees attain better jobs and earn better wages. Of course there is variation among groups and between men and women. For example, recently-arrived Burmese refugees earn low wages, but they rise quickly. Burmese men go from median annual wages of $23,000 to $54,000 after 10 years. Burmese women’s wages increase from $21,000 to $54,000. Somali men and women start at roughly the same wages as the Burmese, but see smaller increases to $37,000 and $35,000, respectively. After ten years in the U.S., all four groups see increases in the share of people working in white collar jobs, while fewer are employed in service and blue collar jobs and farming.
3. Refugees attain higher education levels over time.
Compared to the native-born, refugees reach lower levels of educational attainment. For example 90 percent of the U.S.-born population has a high school degree, but only 62 percent of Somalis, 59 percent of Hmong, and 56 percent of Burmese, and 85 percent of Bosnians have high school degrees. But refugees who arrived as children and were educated in the U.S. have high levels of education that match that of their U.S.-born counterparts. They are much more likely than older-arrivals to graduate from high school and complete bachelor’s degrees.
4. Refugees learn English.
Like all immigrants, refugees tend to learn English over time. Of the four groups studied, Somalis reach the highest level of English language ability, followed by Burmese, Bosnian, and Hmong refugees. After 10 years, 79 percent of Somalis, 66 percent of Burmese, 73 percent of Bosnian, and 62 percent of Hmong speak English well or very well.
5, Refugees are homeowners.
While very few refugees achieve homeownership within their first 10 years in the U.S., they tend to have relatively high rates of homeownership after that. Compared to 68 percent of the U.S. population that owns its own home, 73 percent of Burmese and 72 percent of Bosnians, and 56 percent of Hmong refugees are homeowners. Only 21 percent of Somali refugees own their own homes.
6. Refugees become U.S. citizens.
The vast majority of Bosnian, Burmese, Hmong, and Somali refugees become naturalized citizens. Compared to other immigrants, refugees have high naturalization rates. After 10 years or less in the U.S., only 15 percent of all immigrants have become U.S. citizens. However, 43 percent of Hmong refugees and 40 percent of Bosnia refugees are citizens. After 21 years in the U.S., 71 percent of all immigrants naturalize, compared to 92 percent of Burmese, 82 percent of Somali, 79 percent of Hmong, and 78 percent of Bosnian refugees.
The report from CAP and FPI clearly demonstrates that refugees are integrating into U.S. society and contributing to our economy. While proper precautions and screening procedures are certainly necessary and do exist, the U.S. must continue to offer refuge to those fleeing persecution. Rather than scapegoating or vilifying them, Americans should acknowledge their contributions and welcome them into our communities.
Photo by J Sh.
FILED UNDER: Center for American Progress, featured, Fiscal Policy Institute, refugees


