With the 2022 midterm elections just weeks away, all eyes are shifting to states where close races are expected. A lot has changed since the last midterm elections in 2018—including the demographics of the American electorate.
The 2020 Census has already shown how the U.S. population has continued to diversify. This demographic change is now also impacting the makeup of the electorate in every state as younger, more diverse generations of U.S.-born people age into voting eligibility. More foreign-born individuals have also taken the important step of gaining U.S. citizenship and the right the vote.
Using data from the Current Population Survey, the Council has created an interactive map that shows how each state’s electorates have changed across racial, ethnic, and age lines since 2016. These changes are important to understand how a more diverse electorate will help determine who wins and loses close races in swing states.
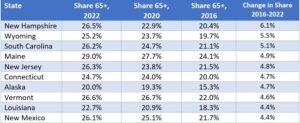
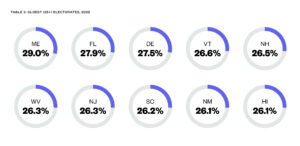
For example, New Hampshire saw the largest relative increase in the share of its eligible voter population that was 65 years or older. From 20.4% in 2016, the elderly share of the electorate increased by more than 6 percentage points to reach 26.5 %, meaning more than 1 out of 4 eligible voters in the Granite State were 65 years or older. In Maine, where there is a close contest in the state’s first congressional district, almost 3 in 10 eligible voters are 65 or older, the oldest electorate in the United States. 
Fastest Aging Electorates, 2016-2022
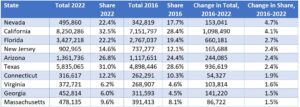
 Several swing states added a large number of Hispanic voters to their electorates since 2016. Nevada, which has a competitive senate contest this year, saw the largest increase in the Hispanic share of its voting eligible population since 2016. The share of Nevada’s electorate that identified as Hispanic increased by almost 5 percentage points, from 17.7% in 2016 to 22.4% in 2022.
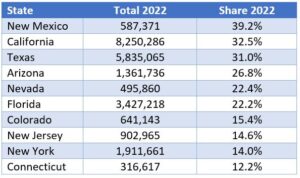
Other states with close Senate or House contests, like Florida (+2.7 percentage points to 22.2% of the electorate), Arizona (+2.4 percentage points to 26.8%), and Texas (+2.4 percentage points to 31.0%) also saw strong growth in the Hispanic share of their eligible voter populations. Overall, New Mexico had the largest share of its electorate that was Hispanic, with almost 4 out 10 eligible voters identifying as Hispanic. California and Texas also had electorates where more than 3 out of 10 eligible voters were Hispanic.
States with Fastest Growing Hispanic Electorates, 2016-2022
States with Largest Hispanic Electorates, 2022
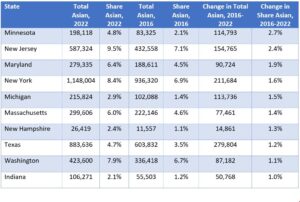
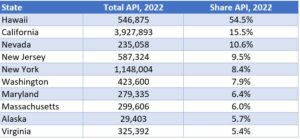
Asian and Pacific Islanders (APIs) are also an increasingly important segment of the electorate in several states. Minnesota saw the fastest relative growth in its API voting eligible population, which grew by 2.7% to reach almost 5% of the state’s electorate.
Texas, home to increasing numbers of Asian immigrants, also saw a significant increase in the share of eligible voters that were API. From 2016 to 2022, the share of eligible voters that identified as API increased by 1.2 percentage points to reach 4.7% of the state’s electorate. Meanwhile in Nevada, on top of the fast-growing Hispanic electorate, APIs now make up more than 1 in 10 eligible voters.
States with Fastest Growing Asian and Pacific Islander Electorates, 2016-2022
States by Asian and Pacific Islander (API) Share of the Electorate, 2022
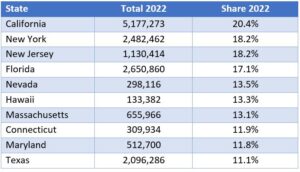
Nationwide, there were almost 23 million foreign-born eligible voters, now making up around 1 in 10 voters. In some critical swing states, the number of immigrant voters is even higher, in numbers that could exert significant electoral force.
Florida, a traditional immigrant destination and a state with more than one close contest, saw rapid growth in the number and share of immigrant eligible voters between 2016 and 2022. The immigrant share increased by 2.1 percentage points to reach 17.1% of the state’s electorate. Texas also saw significant growth among immigrant voters, with the immigrant share of the electorate increasing by almost 2 percentage points to reach 11.1%. This means 1 in 9 eligible voters in Texas are immigrants. Georgia also saw significant growth among immigrant voters, with the immigrant share increasing by 1.4 percentage points to reach 6.8%.
States with Fastest Growing Foreign-Born Electorates, 2016-2022
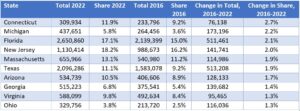
States with Largest Immigrant Shares of the Electorate, 2022
Given the outcomes of various electoral contests since 2016, political commentators know better than to embrace the axiom that “demographics is destiny” blindly. Indeed, each subsequent election comes with reminders for campaigns to avoid the pitfalls of taking entire ethnicities or demographic groups’ votes for granted.
While it remains important to understand the make-up of the voting population, understanding how best to reach and appeal to increasingly diverse and intersectional blocs of voters will be key for campaigns looking to adapt effectively now and in the future.
FILED UNDER: Midterm Elections Immigration


